The DL30-G has all of the seven useful functions specified below.
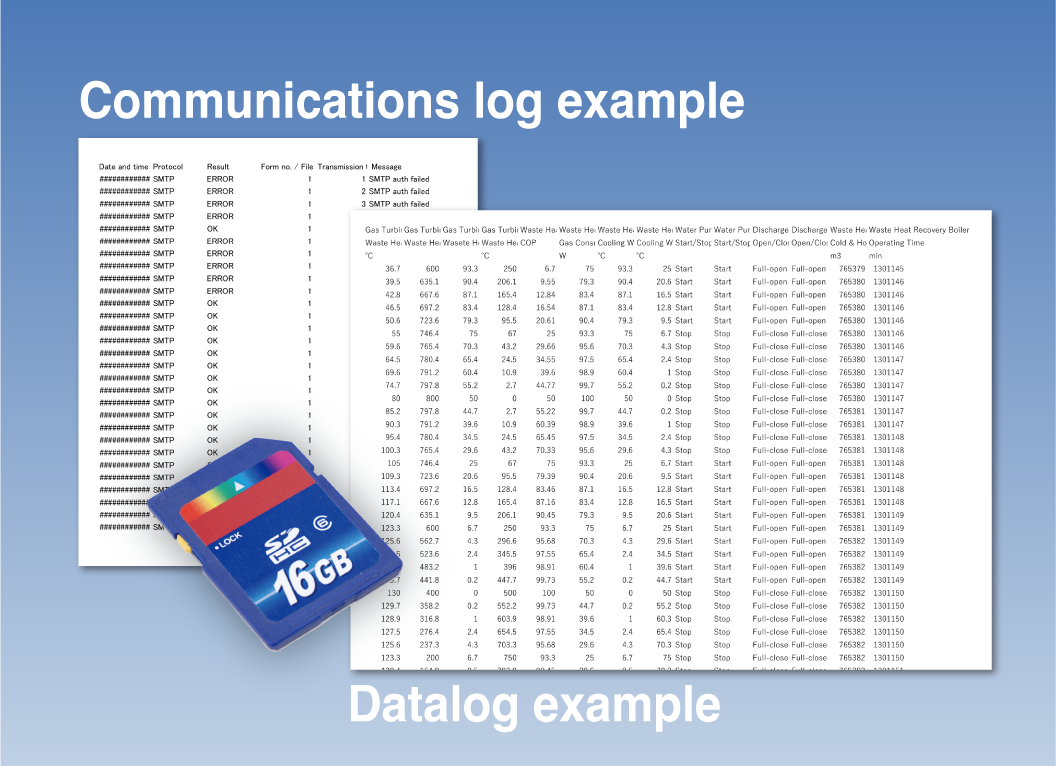
1. Logging
Incorporates sufficient logging functions.
On-site measurement values and event data items are recorded in a large-capacity memory system and transferred to an SD card for recording.
- Records data for more than ten years without maintenance.
- On-site data can be recorded after various types of arithmetic processing.
- Recorded data can be uploaded in CSV format.
Logging / Report Creation (click for more information)
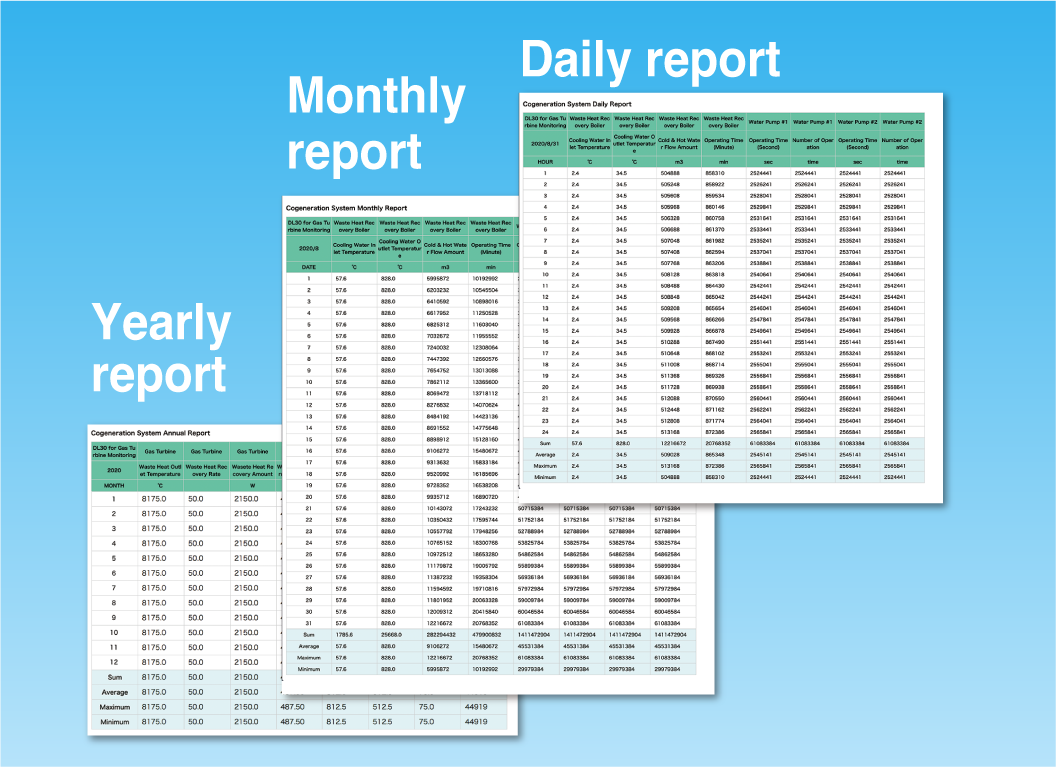
2. Report creation
The DL30-G incorporates a convenient report creation function.
Daily/Monthly/Annual reports are automatically created from the recorded data.
No report-creating software for external PCs is required.
- Created report can be uploaded in CSV format.
- You can attach files to emails or monitor them from a web screen.
Logging / Report Creation, Remote Monitoring Web Server (click for more information)
3. Remote Monitoring Web Server
This is an on-site web server that can be accessed from any terminal with a browser.
The DL30-G generates various web browser screens where you can monitor the state of the site in real time from a PC or smartphone.
- No application software is required on the terminal side (PC or smartphone etc.) as long as it has a browser.
- Provided with various web browser screens as standard features, including trend, data, event, report, download, and schedule screens.
- Possible to create user-defined screens.
- Remote control is also possible, not just monitoring.
Remote Monitoring Web Server (click for more information)
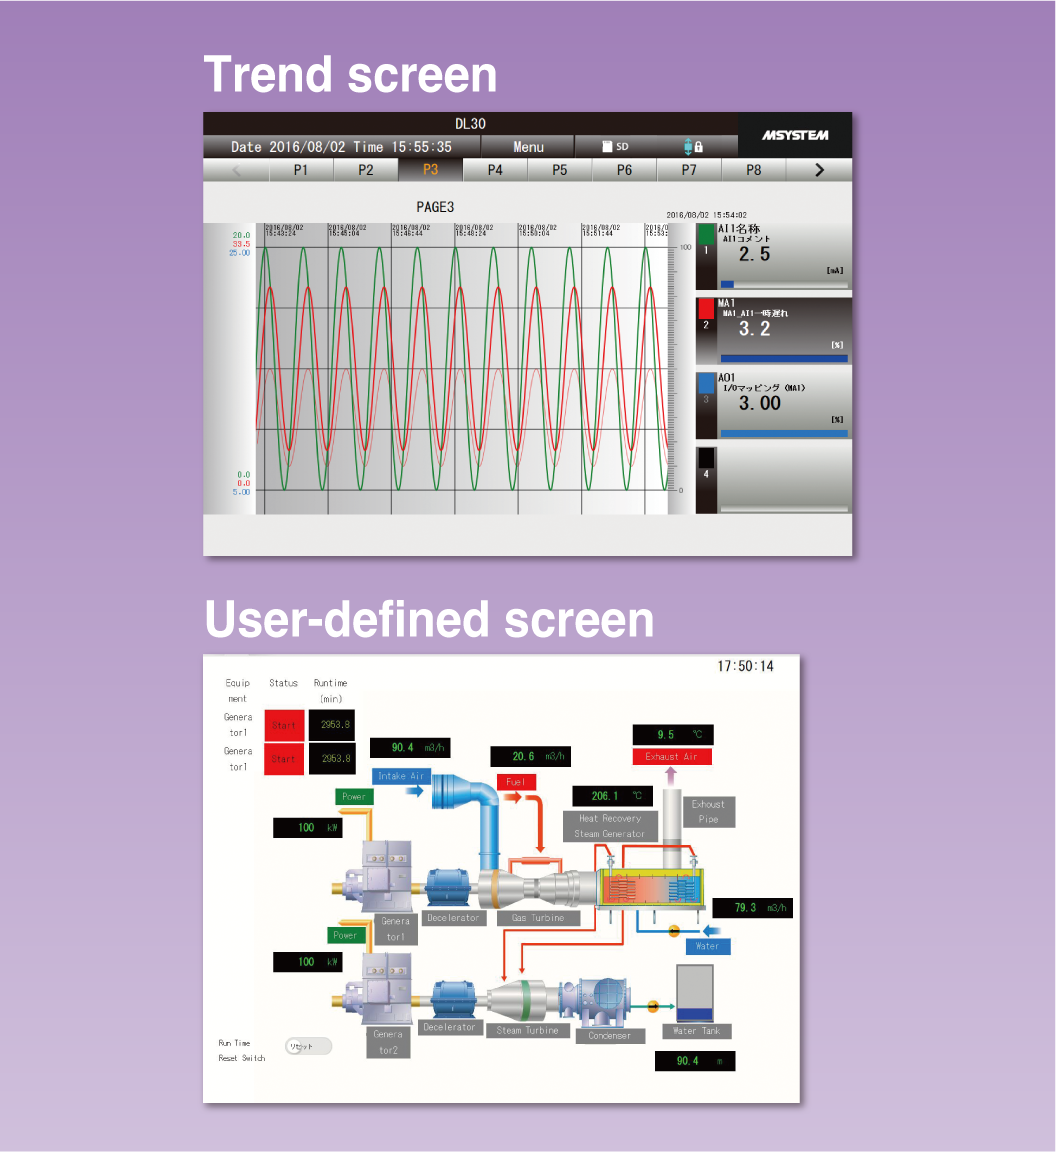
The screen is an image only.
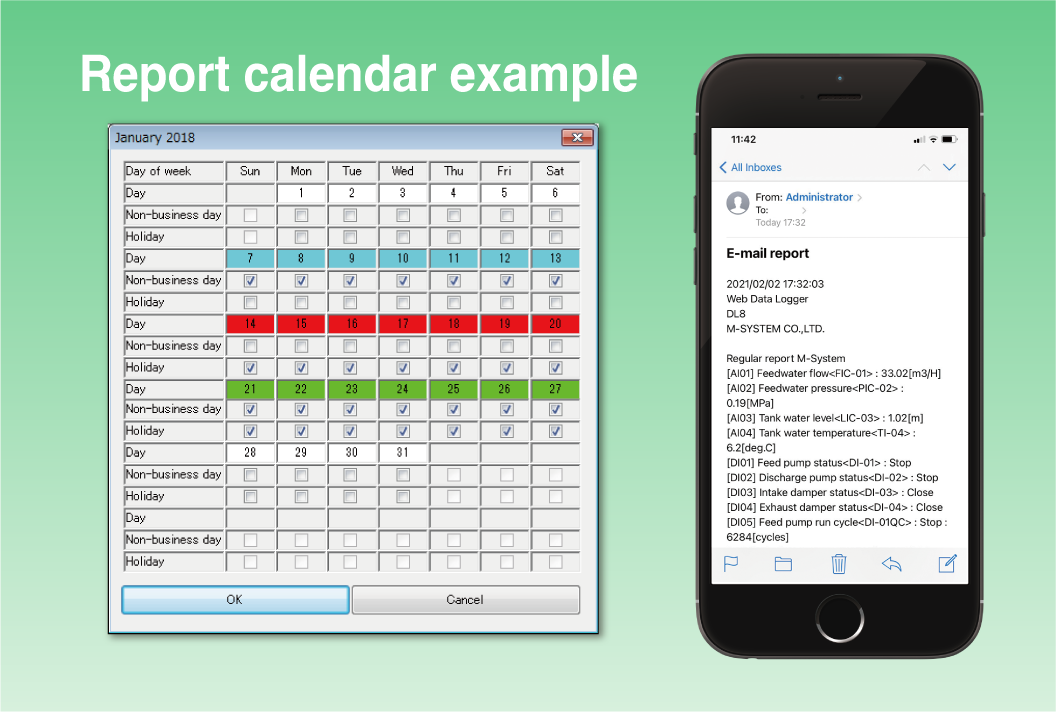
4. Mail Reporting
The DL30-G is an on-site security guard that makes email reports.
It automatically notifies you by email if on-site data becomes an abnormal value or if an on-site device starts or stops.
- You can set a maximum of 64 report destinations, and you can make address and report content changes using remote settings.
- It has a built-in reporting calendar, and you can stop emails on holidays.
- You can attach report files to emails.
Mail Reporting (click for more information)
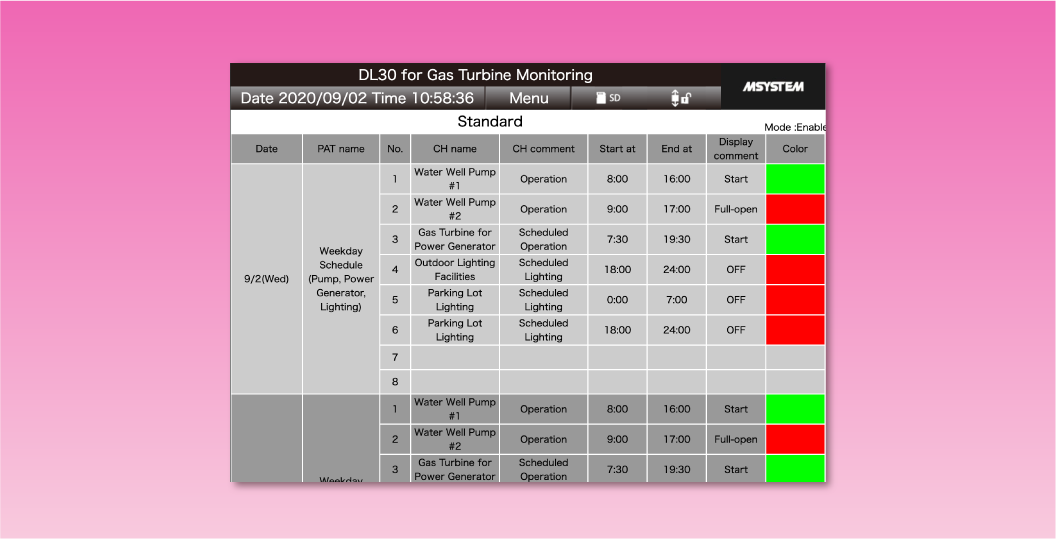
5. Scheduling
The DL30-G incorporates a reinforced schedule function, thus automatically turning building air conditioning equipment and lighting equipment on and off as scheduled.
The schedule function starts and stops equipment and devices according to a schedule registered in advance. For example, the pre-cooling operation of the system is performed before the start of work, and forced stops are automatically performed during breaks.You can schedule and register a weekly start/stop pattern, and easily change the pattern for holidays.
Logging / Report Creation, Remote Monitoring Web Server (click for more information)
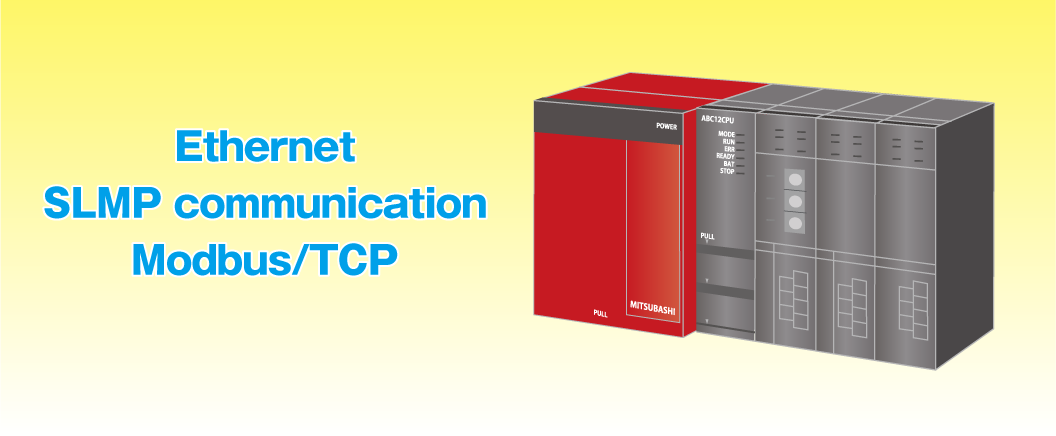
6. Communications Control
The DL30-G is equipped with enhanced communication control functions to work as an on-site command tower.
The DL30-G is equipped with a full range of communication control functions for communication with cloud servers, PCs on the Internet, remote I/O, and network communication with PLCs.
- FTP server / client function
- HTTPS and FTPS communications supported
- Modbus/TCP master/slave function
- I/O mapping function
- SLMP communication function (CC-Link Partner Association’s SLMP-standard compliant)
- SNTP communication function (automatic time adjustments)
Communications Control (click for more information)
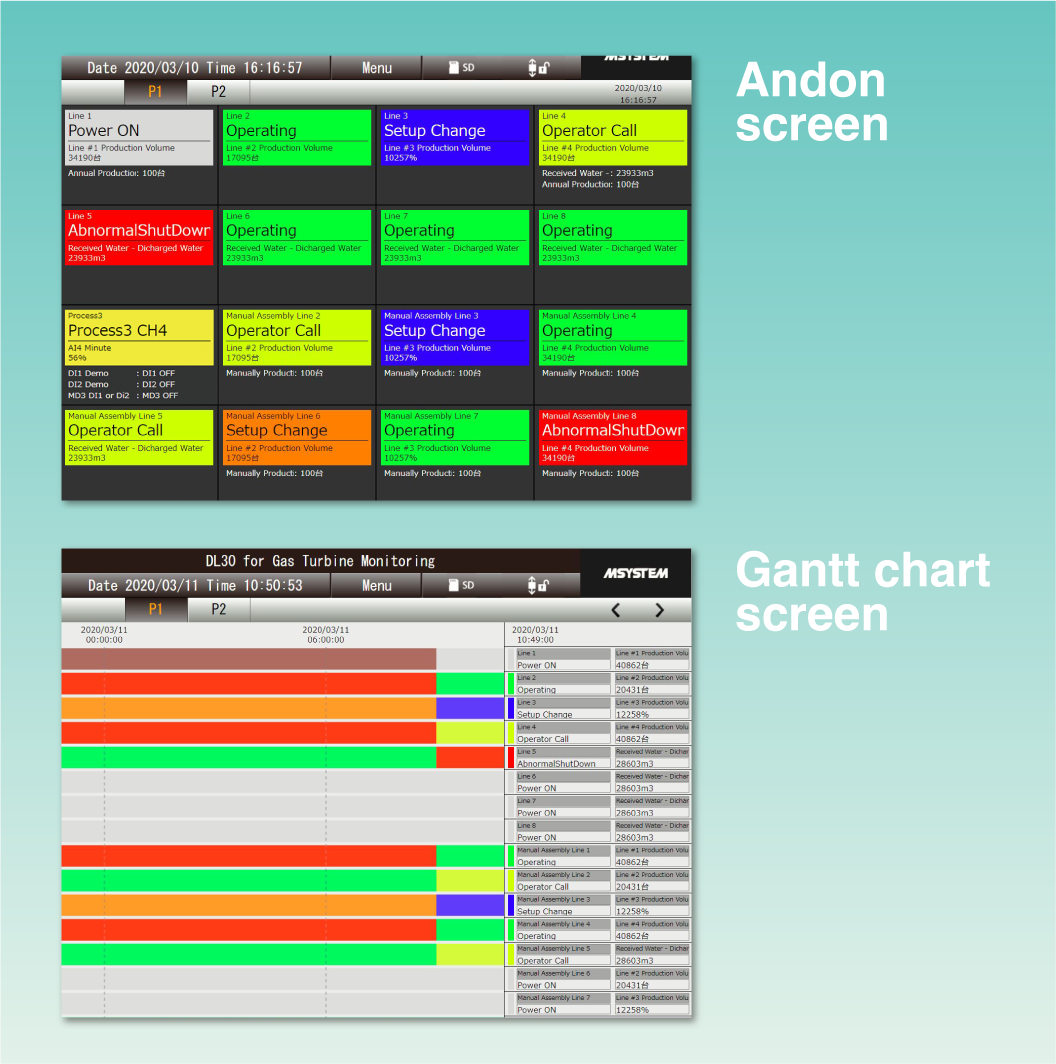
7. Process Operation Monitoring
Incorporating an operation monitoring function.
You can monitor the equipment from your PC or smartphone on the Andon Screen and Gantt Chart Screen, where you can see the operating status of the equipment at a glance.
- The Andon Screen shows the status of equipment and production lines in real time.
- The arithmetic function performs time display and completes analysis operations.
- The screen displays up to five status levels of both digital data and analog data.
- The state of the device and the numerical value (range) are visually expressed with the time axis displayed in the Andon’s color.
Process Operation Monitoring (click for more information)
The screen is an image only.