DL30 시리즈 Web Browser Views
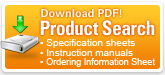
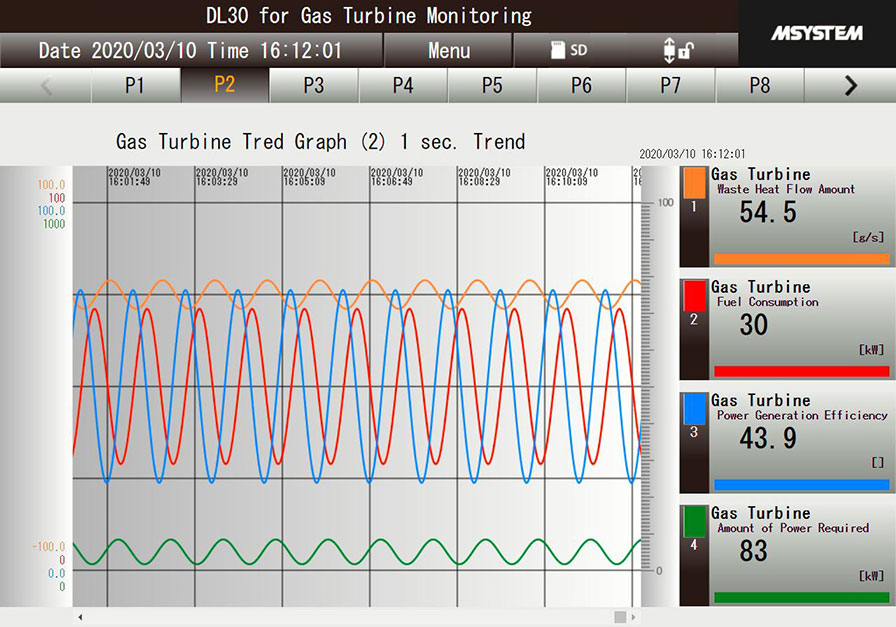
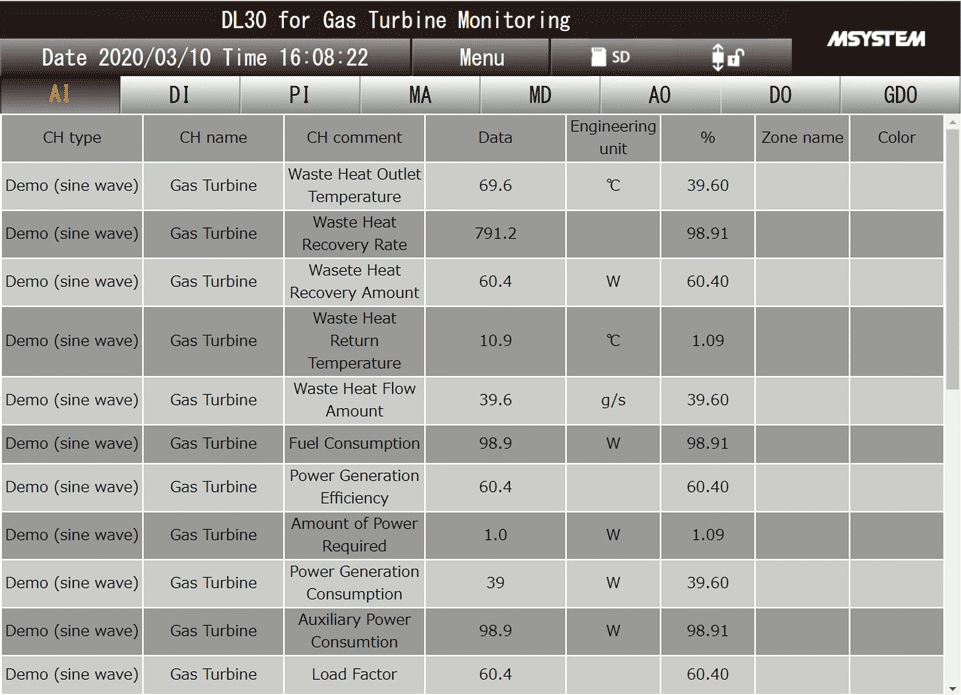
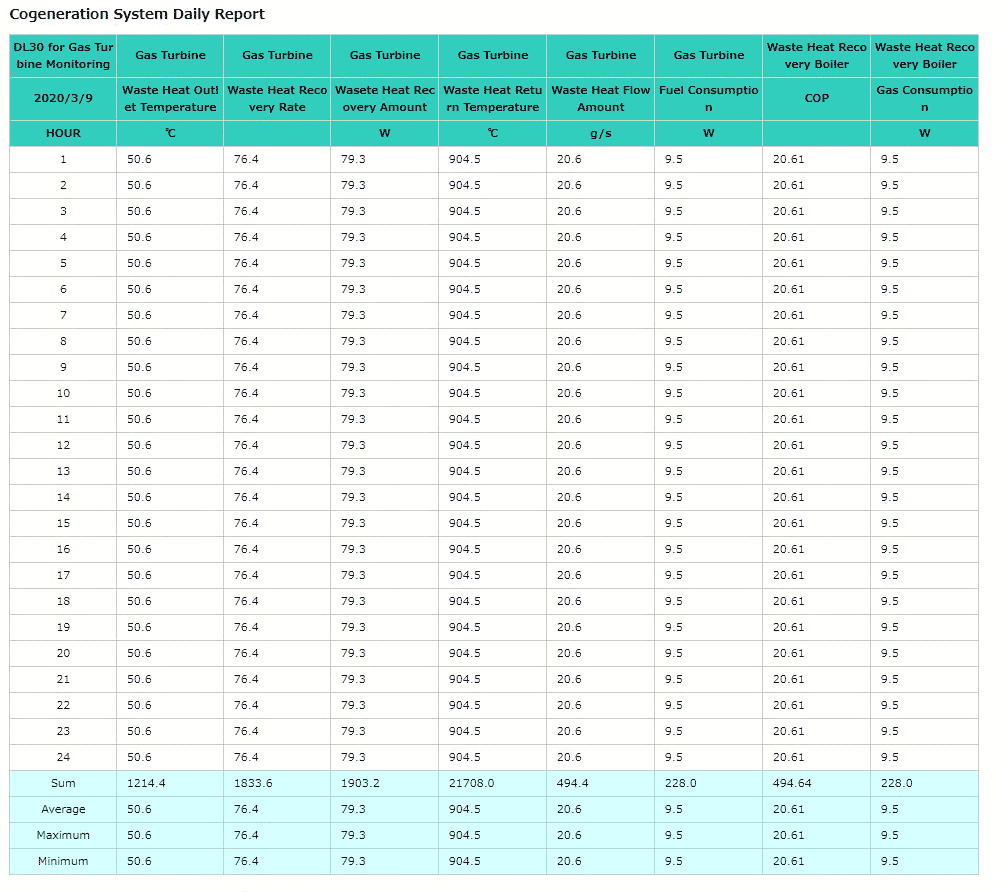
Users do not need any additional application program to view the data. User-friendly browser views are already installed: Data, Trend, Event and Report views. Each one is basic but useful, designed for ease of browsing on a small screen of smart phones and tablets.
Trend data, logging data, and report data are written into the internal memory at a specified writing cycle. The logging data and report data can be transferred to an SD card at a timing according to the writing cycle.
Event data (event logs, system logs, communication logs) is written into the internal memory every time an event occurs, and can be transferred to an SD card in a one-minute cycle.
| Process Operation Monitor Function |
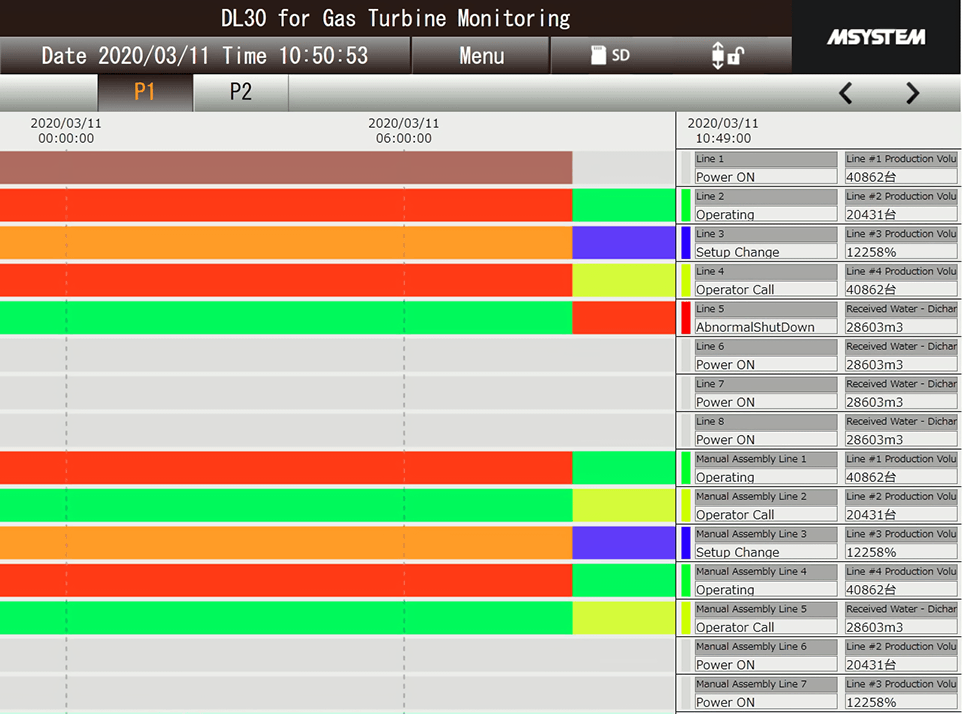
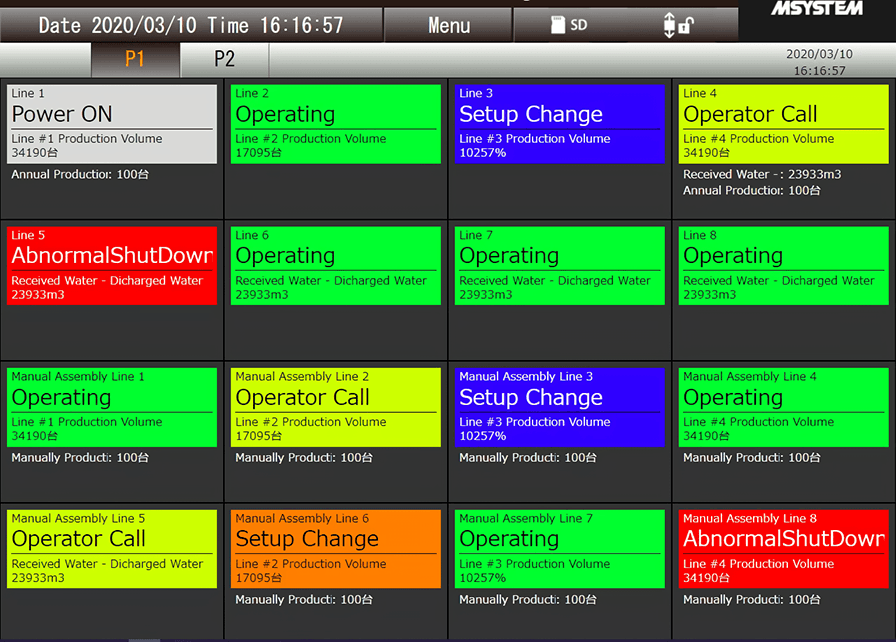
DL30-G defines a single analog channel or a group of discrete channels of different types as a “process” and monitors each process using Gantt chart for displaying the operational history and Andon screen for displaying the process status.
No. of processes: Max. 32 processes
Type of process: Analog / Digital
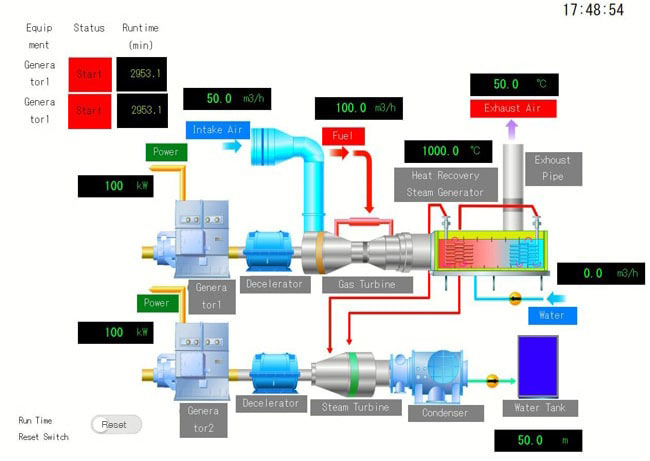
| User-Definable Web Screens*5 |
You can create web screens freely by making full use of HTML, JavaScript image data (gif or jpg), CSS, etc. Furthermore, the current value of data measured by the DL30-G can be read as a JavaScript data file.
DL30 Web Designer (user-defined screen creation software for the DL30-G) is available as a dedicated tool for easily creating user-defined screens. The created data is transferred from DL30 Web Designer to the DL30-G through a USB cable or over the Ethernet. The maximum capacity is 4 MB.
*5. The DL30 Web Designer is downloadable for free at our website.
The screen is an image only.